← Go back to the interactive notebook
Background Theory: Free-Electron Bands in a Periodic Lattice
Original notebook: theory_free_electron.ipynb
Introduction
This notebook gives a brief overview of the empty lattice approximation (free-electron model) of electrons in a metallic solid.
Empty lattice approximation
In the empty lattice approximation, the electrons move “freely” in a weak, periodic potential. Electron-electron interactions are neglected. The eigenfunctions of the Schrödinger equation for free electrons are:
When lies outside the 1st Brillouin zone, the plane wave can be written as:
where vector is inside the first Brillouin zone and is a reciprocal lattice vector. The dispersion is:
You can read more about this model on Wikipedia.
Electronic band structure
In solid-state physics, the electronic band structure of a solid characterizes the quantum-mechanical behavior of electrons.
“Band theory derives these bands and band gaps by examining the allowed quantum mechanical wave functions for an electron in a large, periodic lattice of atoms or molecules. Band theory has been successfully used to explain many physical properties of solids, such as electrical resistivity and optical absorption, and forms the foundation of the understanding of all solid-state devices (transistors, solar cells, etc.).” - from Wikipedia.
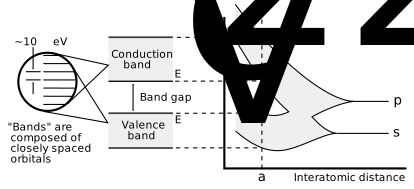
Molecular diagrams can represent the discrete energy levels in molecular systems. In contrast, solid-state systems always have a macroscopic number of orbitals present. This leads to the energy levels merging together and forming a continuum. Hence, the energy levels in solid are considered to be continuous energy bands.
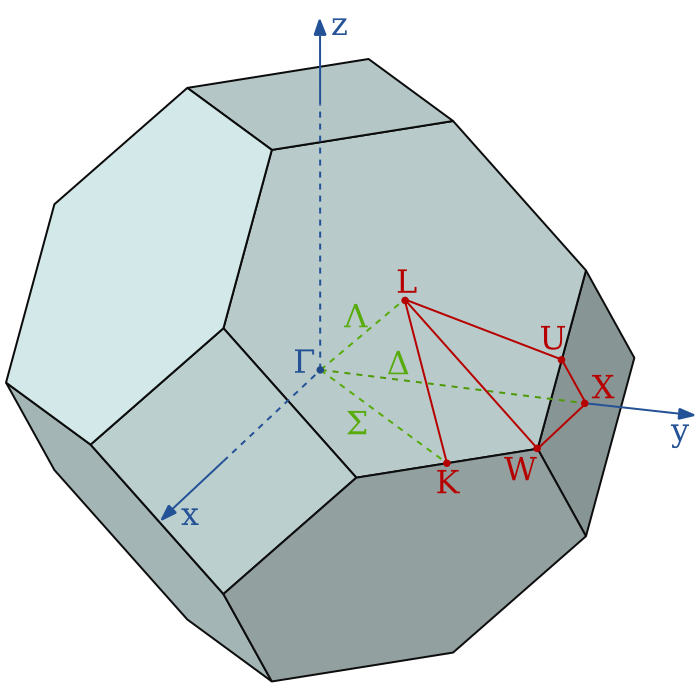
Since the wavevector is three dimensional, having components , and , it is difficult to plot the bands as a function of the wavevector. Therefore, the energy bands are typically plotted along straight lines, connecting high symmetry points of the Brillouin zone (see, e.g. Figure 2).